
The restaurant business is highly competitive, and becoming increasingly so. Restaurants are always competing to attract new customers, while trying to retain and build loyalty among existing ones. Their success could be measured using parameters such as: menu, price, food quality, service, atmosphere, etc. Success in restaurant management always comes down to customer opinion. If we want our establishment to be successful and healthy, we need to listen to our customers, not just today but always.
Today, the internetgives us the opportunity to listen to customers continuously, which is a good medium. Customers use this medium because they can express themselves anonymously and be as explicit as they wish. Many lessons can be learned from actively listening to them; however, trying to read all the messages, in addition to being an arduous task, can be an almost impossible challenge due to the volume of information that is difficult to analyze and process in detail, not only the messages addressed to us but also those from our competitors.
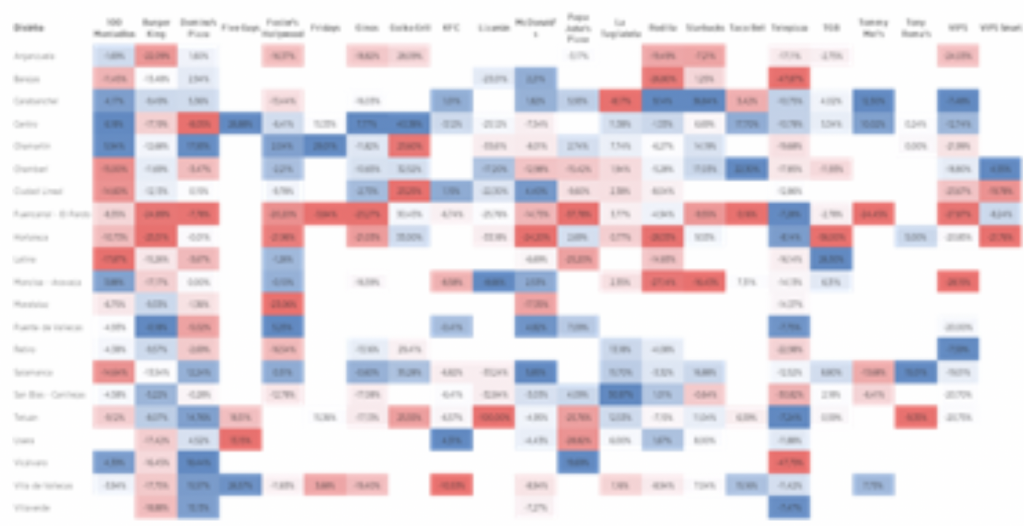
BRAINTRUST uses the NPS (Net Promoter Score) index to analyze the information received by restaurants in order to improve the customer experience. The NPSoffers us two clear advantages: first, it allows us to see how customer opinion about our business is evolving, and second, it allows us to compare ourselves with our direct competitors. Thanks to techniques such as web scraping techniques, it is possible to extract and examine information from websites. An example is the following graph, which analyzes the Recommendation Index with opinions posted on Google about 22 restaurant chains distributed across 1,960 establishments in Madrid.
 Information obtained thanks to the opinions of thousands of people, which has been measured in a consistent manner over time, providing us with sufficient validity as target indicator of the customer experience. BRAINTRUST, through the analysis process ETL (Extract Transform Load), inquires about the motivations that have led the customer to recommend one restaurant over another. The ETL Reads, analyzes, and converts comments into a database. This database is examined by a standard analytical program, allowing us to understand what customers are saying and why our NPS and that of our competitors are what they are.
This study reveals some very significant issues related to the importance of the personal touch: many mentions of specific employees (waiters) by name, as the reason for a memorable experience (or the opposite); few mentions of price when the experience is good (could we possibly charge a little more...?); specific dishes that work and those that don't (is it really that difficult to change the menus?); portions that are too small and annoy customers (is saving 30 grams on a sirloin steak really worth it?); or chains that base their advertising on promotions that customers don't talk about at all (are we communicating effectively?).
Location and market share are two other key elements to consider: knowing where we are, how many potential customers pass by our door, which competitors are nearby, which ones are taking away our customers... Google's public information allows us to find out the relative "market share" in an area by time slot and support our decisions regarding offerings, promotions, and location with "hot" data. Without a doubt, the data contains very valuable information for managing a restaurant.
After the analysis, it is time to start thinking about and implementing our customers' constant demands through improvement plans, carrying them out and checking that the changes are noticed and appreciated by the customer in order to differentiate ourselves positively from the competition. The information provided by feedback from different metrics will simplify and support strategic decision-making in terms of optimization and profitability for our restaurant. The key to the restaurant business is based on actively listening to customers, via the internet, in order to establish a direct connection between our business and the customer experience.